

Image Details
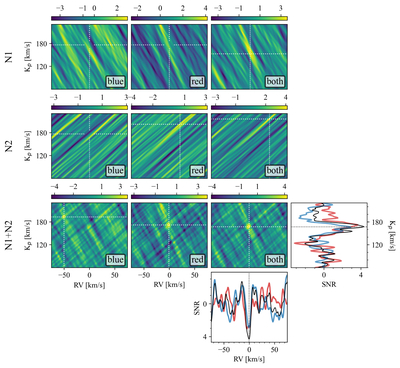
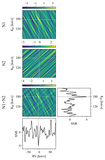
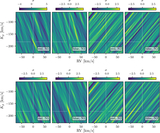
Caption: Figure 8.
The results of cross correlating our data with the Ca model. The subplots are as described in the caption of Figure 5, though note that the color bar scales are not the same as in Figure 5. Although the individual nights and arms do not yield a peak correlation near the expected location of the planetary signal, we find that the combination of the blue and red arms in the first night of observations (top-right plot) along with the combination of both cameras and both nights (bottom-right plots) yield tentative detections >3σ near the expected planetary location. In particular, the final combined significance of the correlation peak is 4.3σ at ﹩{K}_{{\rm{p}}}=167.{0}_{-2.9}^{+6.0}﹩ km s−1 and RV = 0.1﹩{}_{-4.8}^{+2.0}﹩ km s−1.
Other Images in This Article
Show More
Copyright and Terms & Conditions
© 2026. The Author(s). Published by the American Astronomical Society.

