

Image Details
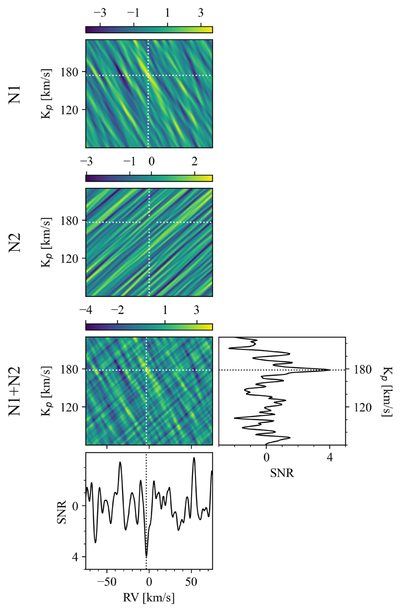
Caption: Figure 7.
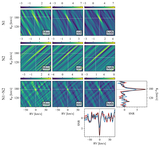
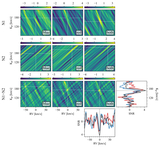
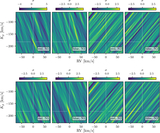
Top: the results of cross correlating our night 1 data with the Si model. The blue arm of the spectrograph data has been excluded from this analysis, due to the fact that it does not contain strong Si lines (see Section 6). The location of the peak Kp and RV values are indicated by converging dotted white lines in each plot with a significant detection. For plots without a significant detection, the expected planetary signal location is indicated by nonconverging dotted white lines (i.e., RV = 0 km s−1; Kp ∼ 176.5 km s−1). The color bars indicate the same as described in the caption of Figure 5, though note the difference in scales. Middle: the same as the top, but for night 2. Bottom: the same as the top, but for nights 1 and 2 combined, with each night weighted by its respective average SNR. Surrounding this plot are slices of the 2D Kp−RV maps at the peak Kp and peak RV for the combined results. The dashed black line represents the combined peak RV and Kp in each plot.
Other Images in This Article
Show More
Copyright and Terms & Conditions
© 2026. The Author(s). Published by the American Astronomical Society.

