

Image Details
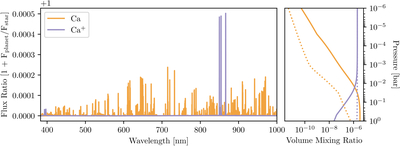
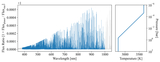
Caption: Figure 10.
Left: the Ca and Ca+ models used in our analysis, as described in Section 4. Right: the VMRs as a function of pressure for Ca and Ca+, as calculated by FastChem. The solid lines represent the VMRs calculated for WASP-178 b, while the dashed lines represent possible VMRs for a hotter, KELT-9 b–like planet, for comparative purposes. The two-point T–P profile for the KELT-9 b–like planet is set at (T1, P1) = (5000 K, 10−3 bar) and (T2, P2) = (4000 K, 10−1.5 bar). This is estimated from the retrievals presented in Y. Zhang et al. (2026, their Figure 5), but is not meant to be a fully accurate representation of the atmosphere of KELT-9 b. We see that at a pressure slightly below 10−2 bar, Ca begins to become more abundant than Ca+ for WASP-178 b. Our observations may be probing at or around this ionization boundary. In comparison, this boundary occurs much deeper in the atmosphere for the KELT-9 b–like planet.
Other Images in This Article
Show More
Copyright and Terms & Conditions
© 2026. The Author(s). Published by the American Astronomical Society.

