

Image Details
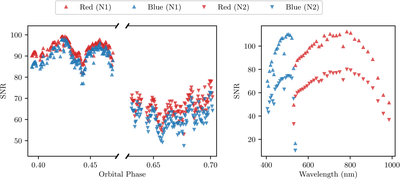
Caption: Figure 2.
Left: the average SNR per exposure for both nights of our observations in both the blue and red cameras. Night 1, corresponding to preeclipse orbital phases, is plotted before the break in the x-axis; while night 2, corresponding to posteclipse phases, is plotted after the break in the x-axis. Note that the break in the x-axis does not correspond exactly to secondary eclipse. Upward-pointing triangles indicate the night 1 data, while downward-pointing triangles indicate night 2 data. Right: the average SNR per order for both nights, plotted against the median wavelength of each order. As in the subplot on the left, the red and blue cameras are color coded in red and blue, while night 1 is represented by upward-pointing triangles and night 2 by downward-pointing triangles. As is clear from the figure, the data quality was on average higher during the first night of observations (likely due to the better observing conditions as described in Section 2).
Other Images in This Article
Show More
Copyright and Terms & Conditions
© 2026. The Author(s). Published by the American Astronomical Society.

