

Image Details
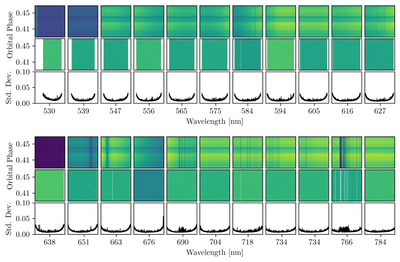
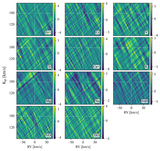
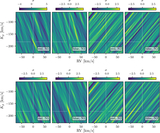
Caption: Figure A2.
The same as Figure A1, but for the first 11 orders (top three rows) and next 11 orders (bottom three rows) in the night 1 red arm of the spectrograph. As explained in Section 3.2, we applied three iterations of SYSREM to the red data.
Other Images in This Article
Show More
Copyright and Terms & Conditions
© 2026. The Author(s). Published by the American Astronomical Society.

Copyright ©
2026 Astronomy Image Explorer. All Rights Reserved.
