

Image Details
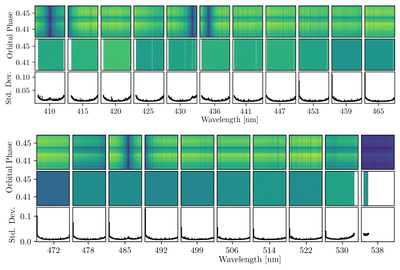
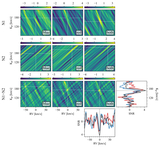
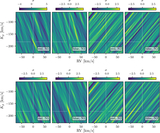
Caption: Figure A1.
The results of applying the SYSREM algorithm to the first 11 orders (top three rows) and last 10 orders (bottom three rows) in the night 1 blue arm of the spectrograph. Top row: the data reduced by DRAGONS. Note that there may be some overlap in wavelength between subsequent orders; each order is displayed separately. Middle row: the results of applying six iterations of SYSREM to the data as described in Section 3.2. At this point, the telluric and stellar absorption features have been removed, and the planetary signal is buried in the noise. Bottom row: the standard deviation of the data after applying SYSREM. The y-scale is the same for all plots in this row.
Other Images in This Article
Show More
Copyright and Terms & Conditions
© 2026. The Author(s). Published by the American Astronomical Society.

