

Image Details
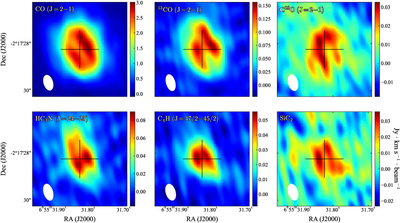
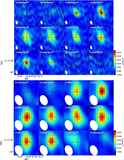
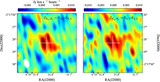
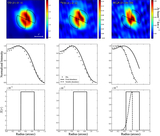
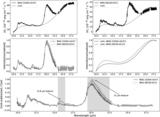
Caption: Figure 9.
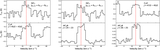
Comparison of moment-zero maps for detected molecular lines in IRAS 06530−0213. Crosses mark the phase center, and the white ellipse in the bottom-left corner denotes the synthesized beam (0﹩\mathop{.}\limits^{{\unicode{x02033}}}﹩72 × 0﹩\mathop{.}\limits^{{\unicode{x02033}}}﹩41). The map of SiC2 is produced by stacking the two maps shown in Figure 8.
Other Images in This Article
Copyright and Terms & Conditions
© 2026. The Author(s). Published by the American Astronomical Society.

Copyright ©
2026 Astronomy Image Explorer. All Rights Reserved.
