

Image Details
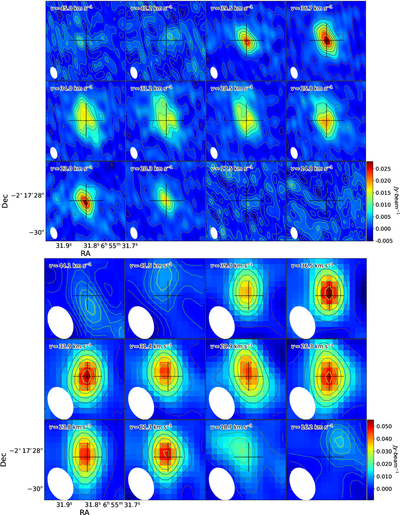
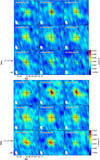
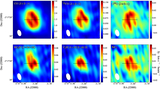
Caption: Figure 4.
Channel maps of HC3N. Contour levels are individually defined for each channel by ten equally spaced lines between the channel’s intensity minimum and maximum. Crosses mark the phase center position, and LSR velocities are labeled in each panel. The object’s systemic velocity is 29.5 km s−1. The white ellipse in the bottom-left corner denotes the synthesized beam. The upper panels are derived from combined data and shows the emission of the J = 24−23 transition with a synthesized beam of 0﹩\mathop{.}\limits^{{\unicode{x02033}}}﹩72 × 0﹩\mathop{.}\limits^{{\unicode{x02033}}}﹩41, while the lower panels come from observations with the 10D configuration and displays the emission of the J = 26−25 transition with a synthesized beam of 1﹩\mathop{.}\limits^{{\unicode{x02033}}}﹩91 × 1﹩\mathop{.}\limits^{{\unicode{x02033}}}﹩29.
Other Images in This Article
Copyright and Terms & Conditions
© 2026. The Author(s). Published by the American Astronomical Society.

