

Image Details
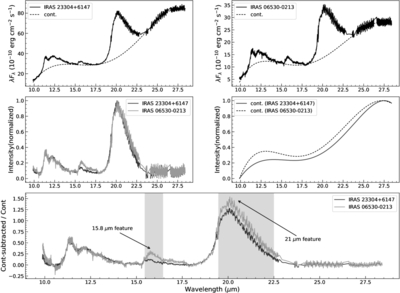
Caption: Figure 11.
Upper: Spitzer/IRS spectra along with fitted polynomial continua of IRAS 06530−0213 and IRAS 23304+6147. Middle: normalized spectra after continuum subtraction (left panel) and normalized continuum profiles (right panel). Bottom: continuum-subtracted spectra divided by their continua. The shaded regions mark the 15.8 and 21 μm features.
Other Images in This Article
Copyright and Terms & Conditions
© 2026. The Author(s). Published by the American Astronomical Society.

Copyright ©
2026 Astronomy Image Explorer. All Rights Reserved.
