

Image Details
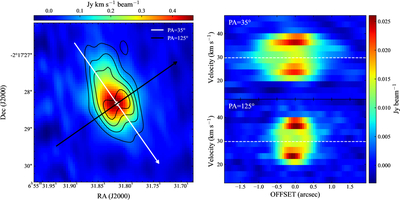
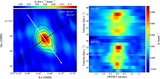
Caption: Figure 5.
Left: moment-zero map of HC3N (J = 24−23) integrated over the full velocity range (color scale), with moment-zero contours overlaid from channels showing toruslike morphology (25.8–34.0 km s−1). Contour levels are defined as 25%, 45%, 65%, and 85% of the peak intensity. White and black arrows mark the directions for extracting PV diagrams at position angles of PA = 35° and 125°, which follow the symmetry axis and equatorial direction of the barrel-like structure, respectively. Right: PV diagrams extracted along the two directions. Dashed lines mark VLSR = 29.5 km s−1. Offsets are measured from the arrow centers, with negative values toward the tails and positive values toward the arrowheads.
Other Images in This Article
Copyright and Terms & Conditions
© 2026. The Author(s). Published by the American Astronomical Society.

