

Image Details
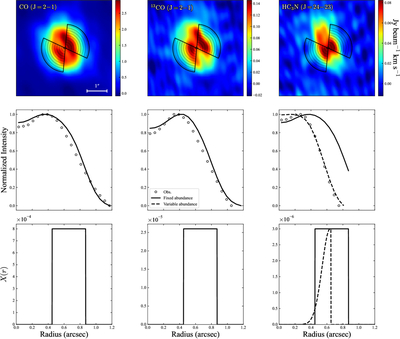
Caption: Figure 10.
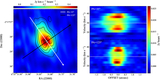
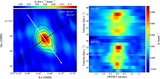
Modeling results from RATRAN calculations compared with observations for CO (left), 13CO (middle), and HC3N (right). The upper panels show moment-zero maps with the equatorial sector extraction regions overlaid. The middle panels compare normalized radial profiles from observations with the corresponding model predictions, where the model profiles have been convolved with the telescope beam. The lower panels show the radial abundance profiles adopted in our models.
Other Images in This Article
Copyright and Terms & Conditions
© 2026. The Author(s). Published by the American Astronomical Society.

Copyright ©
2026 Astronomy Image Explorer. All Rights Reserved.
