

Image Details
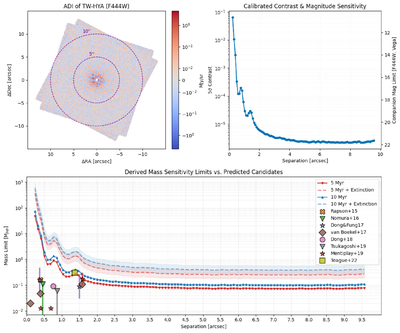
Caption: Figure 11.
Sensitivity limits from our companion search in the F444W filter. The top-left panel shows the ADI-processed image. The top-right panel presents the 5σ calibrated contrast curve (left axis) and corresponding apparent magnitude limit (right axis). The bottom panel displays the derived upper mass limits using E. F. Linder et al. (2019) evolutionary models for system ages of 5 (red) and 10 (blue) Myr. Solid lines represent limits assuming clear conditions, while dashed lines with shaded error regions indicate limits adjusted for local extinction (AF444W ≈ 2.7 ± 0.7 mag). The various markers plot the estimated masses and separations of candidate protoplanets proposed in the literature (detailed in Table 5) to explain previously observed disk substructures.
Other Images in This Article
Show More
Copyright and Terms & Conditions
© 2026. The Author(s). Published by the American Astronomical Society.

