

Image Details
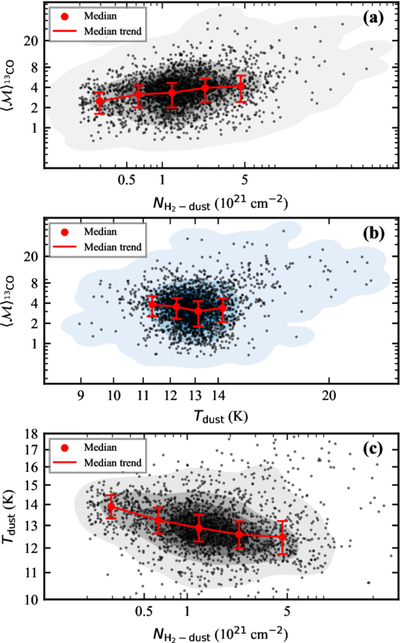
Caption: Figure 14.
The source-averaged 13CO-intensity-weighted Mach number, ﹩{\langle { \mathcal M }\rangle }_{{}^{13}{\rm{CO}}}﹩, vs. the dust-derived H2 column density, ﹩{N}_{{{\rm{H}}}_{2}-{\rm{dust}}}﹩ (a), and the catalog dust temperature, Tdust (b). Panel (c) shows Tdust vs. ﹩{N}_{{{\rm{H}}}_{2}-{\rm{dust}}}﹩ for the same sample. Black points represent individual PGCCs, red symbols indicate median values in logarithmic bins, and error bars show the corresponding median absolute deviations. Gray and blue contours trace the kernel-density distribution.
Other Images in This Article
Show More
Copyright and Terms & Conditions
© 2026. The Author(s). Published by the American Astronomical Society.

Copyright ©
2026 Astronomy Image Explorer. All Rights Reserved.
