

Image Details
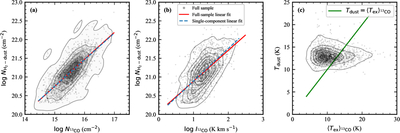
Caption: Figure 12.
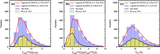
Source-averaged gas–dust comparisons using the fixed-β = 2 dust quantities from the PGCC catalog. Panels (a) and (b) show ﹩{N}_{{{\rm{H}}}_{2}-{\rm{dust}}}﹩ vs. ﹩{N}_{{}^{13}{\rm{CO}}}﹩ and ﹩{I}_{{}^{12}{\rm{CO}}}﹩, respectively. Gray points and contours represent the source sample in each panel, and red solid lines show logarithmic linear fits to the full samples. Blue dashed lines, shown only in panels (a) and (b), give the corresponding single-component fits used to test the influence of multicomponent sightlines; the subsets are defined by one detected 13CO component in panel (a) and one detected 12CO component in panel (b). Panel (c) compares the catalog dust temperature, Tdust, with the 13CO-intensity-weighted excitation temperature, ﹩{\langle {T}_{{\rm{ex}}}\rangle }_{{}^{13}{\rm{CO}}}﹩; the green line marks equality.
Other Images in This Article
Show More
Copyright and Terms & Conditions
© 2026. The Author(s). Published by the American Astronomical Society.

