

Image Details
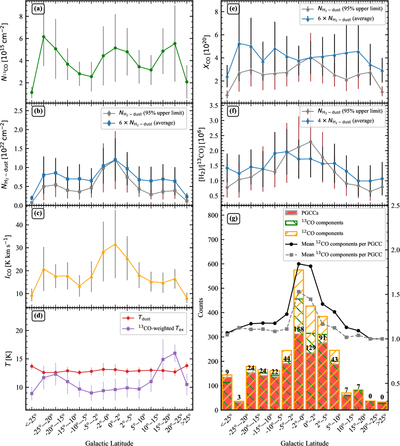
Caption: Figure 11.
Galactic-latitude dependence of source-averaged gas–dust quantities and velocity-component statistics. Panels (a)–(f) show the binned median trends of (a) ﹩{N}_{{}^{13}{\rm{CO}}}﹩, (b) ﹩{N}_{{{\rm{H}}}_{2}-{\rm{dust}}}﹩, (c) ﹩{I}_{{}^{12}{\rm{CO}}}﹩, (d) the catalog dust temperature together with the 13CO-intensity-weighted excitation temperature, (e) XCO, and (f) [H2]/[13CO]. Error bars indicate the corresponding median absolute deviations. In panels (b), (e), and (f), gray symbols use the 95% upper confidence limit of ﹩{N}_{{{\rm{H}}}_{2}-{\rm{dust}}}﹩, while blue symbols show the nominal catalog estimate multiplied by constant factors for display only, as indicated in the legends. Panel (g) presents the Galactic-latitude distributions of PGCCs, 13CO velocity components, and 12CO velocity components, together with the mean numbers of 12CO components per PGCC and 13CO components per 13CO-detected PGCC. Numbers above the bars denote the counts of PGCCs with multiple 12CO velocity components in each latitude bin.
Other Images in This Article
Show More
Copyright and Terms & Conditions
© 2026. The Author(s). Published by the American Astronomical Society.

