

Image Details
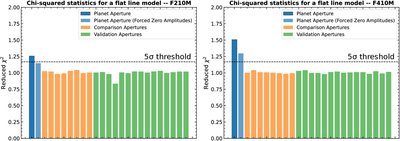
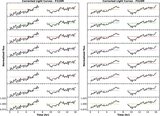
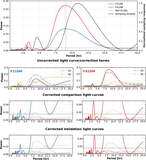
Caption: Figure 9.
Significance of the variability detection demonstrated by χ2 statistics. We compare the corrected light curves extracted from the planet, comparison, and validation apertures with a flat line and compute the χ2 deviation. The planet’s light curves show deviations far exceeding a 5σ threshold. All validation light curves are consistent with the flat line model.
Other Images in This Article
Show More
Copyright and Terms & Conditions
© 2026. The Author(s). Published by the American Astronomical Society.

Copyright ©
2026 Astronomy Image Explorer. All Rights Reserved.
