

Image Details
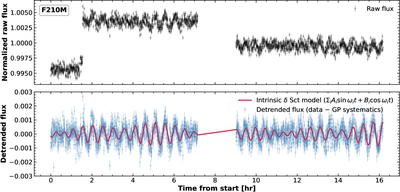
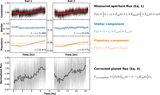
Caption: Figure 3.
F210M light curve of the host star. Upper panel: the raw aperture photometry shows strong oscillation signals consistent with β Pic’s known oscillation periods. Instrument systematics induce apparent flux jumps. Lower panel: a Gaussian process successfully removes the systematic trend. The corrected light curve is well fit by four sine waves representing the strongest oscillation modes (red curve).
Other Images in This Article
Show More
Copyright and Terms & Conditions
© 2026. The Author(s). Published by the American Astronomical Society.

Copyright ©
2026 Astronomy Image Explorer. All Rights Reserved.
