

Image Details
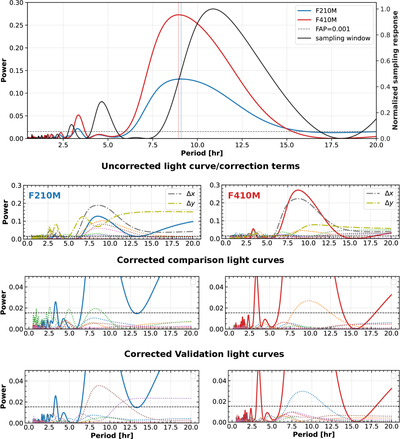
Caption: Figure 10.
Lomb–Scargle periodograms of β Pic b in F210M (blue) and F410M (red). Top: periodograms of the corrected target light curves. Both filters show a dominant peak near ∼8–9 hr above the 0.1% FAP level (dashed line). Vertical dotted lines mark the peak period in each filter. The black curve shows the normalized sampling window, computed from the observation times and plotted against the right axis. The F410M light curve shows the stronger detection. Second row: periodograms of the uncorrected target light curves (dotted lines) and centroid offset correction terms Δx (gray dashed–dotted line) and Δy (olive dashed–dotted line). These panels show periodic signatures associated with instrumental systematics and correction terms. Bottom two rows: periodograms of corrected comparison light curves (third row) and corrected validation light curves (fourth row) from the same datasets.
Other Images in This Article
Show More
Copyright and Terms & Conditions
© 2026. The Author(s). Published by the American Astronomical Society.

