

Image Details
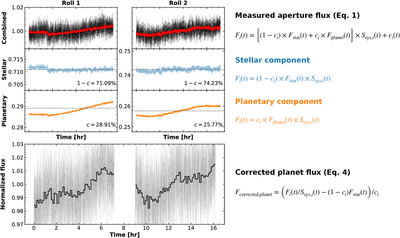
Caption: Figure 7.
Demonstration of the light-curve correction procedure using the F410M data. The top panels show the measured planet-aperture light curves in the two telescope rolls. Black dots are the raw flux measurements. Red lines are the best-fitting light-curve model (Equation (1)). The second and third rows decompose the aperture model into stellar (blue) and planetary (orange) components. The bottom row shows the isolated planetary light curve. The corresponding correction formula are provided on the right.
Other Images in This Article
Show More
Copyright and Terms & Conditions
© 2026. The Author(s). Published by the American Astronomical Society.

Copyright ©
2026 Astronomy Image Explorer. All Rights Reserved.
