

Image Details
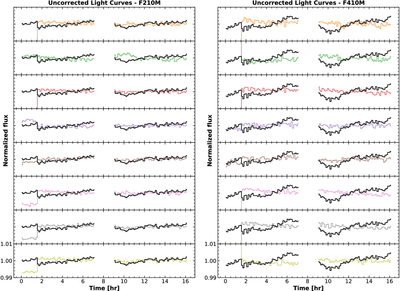
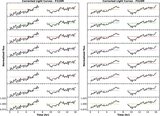
Caption: Figure 6.
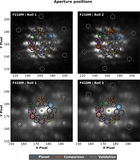
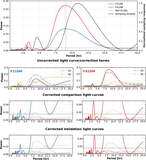
F210M and F410M light curves (the Fi(t) term in Equation (1)). Light curves measured in the planet apertures are plotted in black lines and the comparison aperture light curves are plotted in the same colors as their apertures in Figure 5.
Other Images in This Article
Show More
Copyright and Terms & Conditions
© 2026. The Author(s). Published by the American Astronomical Society.

Copyright ©
2026 Astronomy Image Explorer. All Rights Reserved.
