

Image Details
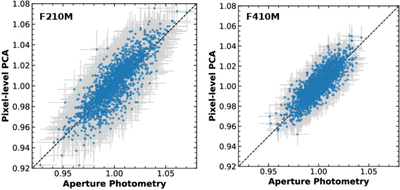
Caption: Figure 13.
Comparisons between the nominal method and the pixel-level PCA method. The two measurements are shown in the x- and y-dimensions. The black dashed lines show the one-to-one correlation. Both methods produce statistically consistent results for F210M and F410M data.
Other Images in This Article
Show More
Copyright and Terms & Conditions
© 2026. The Author(s). Published by the American Astronomical Society.

Copyright ©
2026 Astronomy Image Explorer. All Rights Reserved.
