

Image Details
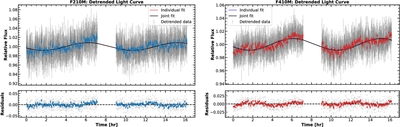
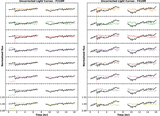
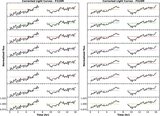
Caption: Figure 11.
Detrended light curves of β Pic b in F210M (blue) and F410M (red) and the best-fitting sinusoids. The colored solid lines show the best-fit sinusoid from the individual-filter fit, and the black solid line shows the best-fit sinusoid from the joint fit across both filters. These two fits are almost identical and result in nearly indistinguishable solution. Residuals after subtracting the joint fit are shown in the bottom subpanels.
Other Images in This Article
Show More
Copyright and Terms & Conditions
© 2026. The Author(s). Published by the American Astronomical Society.

Copyright ©
2026 Astronomy Image Explorer. All Rights Reserved.
