Image Details
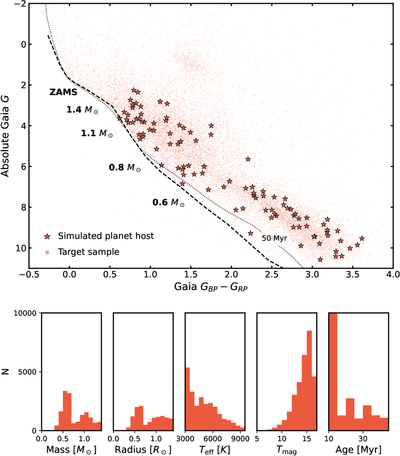
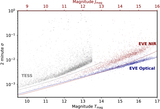
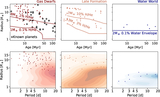
Caption: Figure 3.
The stellar property distribution encompassed within the EVE fields is plotted over the color–magnitude diagram (top), and as a function of stellar mass, radius, effective temperature, magnitude, and age (bottom). The zero-age main sequence (ZAMS) and the 50 Myr solar metallicity nonrotating isochrone as per A. Dotter (2016) is marked by the dashed and dotted lines, respectively. The simulated planet hosts are marked by stars. Stellar properties are adopted from the TESS input catalog (K. G. Stassun et al. 2019).
Other Images in This Article
Show More
Copyright and Terms & Conditions
© 2026. The Author(s). Published by the American Astronomical Society.
Copyright ©
2026 Astronomy Image Explorer. All Rights Reserved.