Image Details
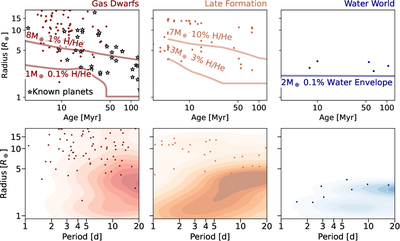
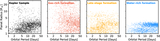
Caption: Figure 10.
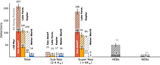
The distribution of simulated planet detections in radius, period, and age. Known young planets are plotted as stars on the top left panel for context. Top row: the radius distribution of planet discoveries as a function of age. The model curves show the modeled radial evolution of select gas-dwarf (red), late-stage formation with 10−3 disk depletion (orange), and water-world (blue) scenarios as per J. G. Rogers (2025) and E. J. Lee et al. (2022). Bottom row: the period radius distributions, with the detected planets plotted in dots, and the input distribution as 2D histograms.
Other Images in This Article
Show More
Copyright and Terms & Conditions
© 2026. The Author(s). Published by the American Astronomical Society.
Copyright ©
2026 Astronomy Image Explorer. All Rights Reserved.