

Image Details
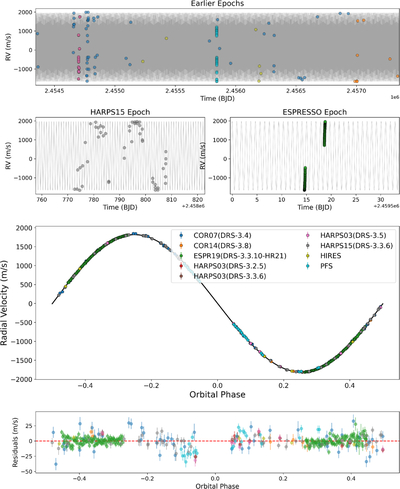
Caption: Figure 5.
Top two rows: phase-folded best-fit model (gray line) plotted against RV observations across three distinct temporal segments to account for the long observational baseline. Third row: RV observations along with the best-fit model in phase space of the WASP-18 b orbital period. Bottom row: residuals from the RV measurements.
Other Images in This Article
Copyright and Terms & Conditions
© 2026. The Author(s). Published by the American Astronomical Society.

Copyright ©
2026 Astronomy Image Explorer. All Rights Reserved.
