

Image Details
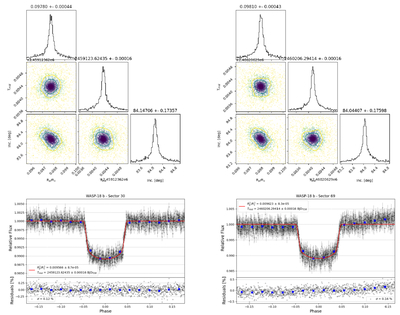
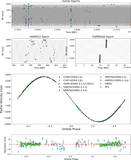
Caption: Figure 2.
Top panels: nested sampling posterior triangle plots and posterior distributions using EXOTIC for WASP-18 b for TESS sectors 30 and 69. The data points are color coded to the likelihood of each fit, with darker colors indicating a higher likelihood. Bottom panels: example phase-folded transit light curves of WASP-18 b for TESS sectors 30 and 69, respectively. The gray points represent the light curve photometry. The blue points represent the binned data. The red curves show the EXOTIC model fit for each transit.
Other Images in This Article
Copyright and Terms & Conditions
© 2026. The Author(s). Published by the American Astronomical Society.

Copyright ©
2026 Astronomy Image Explorer. All Rights Reserved.
