

Image Details
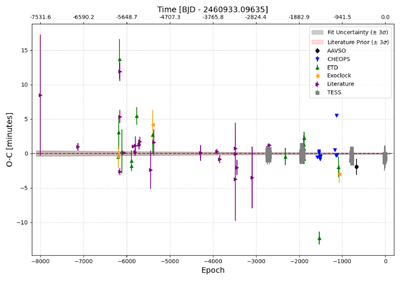
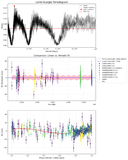
Caption: Figure 3.
Combined residuals using Exoplanet Watch, ETD, ExoClock, Literature (see Table 1), TESS and CHEOPS midtransit times. Each point on the plot shows the observed midtransit time minus the calculated midtransit time from the ephemeris. The dashed horizontal line represents the best-fit linear ephemeris (see Table 5). The light red shaded region represents the 3σ uncertainty propagated from the literature priors (Table 3), while the dark-gray shaded region indicates the 3σ uncertainty of our refined model. Note that there is significant visual overlap between the red and dark-gray shaded regions due to the marginal improvement in our uncertainties from the literature priors relative to the figure scaling.
Other Images in This Article
Copyright and Terms & Conditions
© 2026. The Author(s). Published by the American Astronomical Society.

