

Image Details
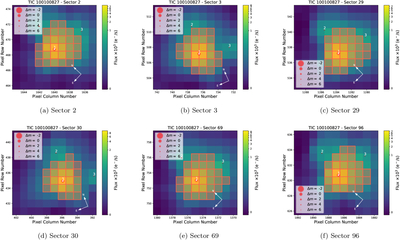
Caption: Figure 1.
Target pixel files for WASP-18 (TIC 100100827) during TESS observations created using tpfplotter (A. Aller et al. 2020) that shows potential contamination and dilution from neighboring stars. The 11 × 11 pixel flux map displays the electron flux (e− s−1) per pixel. The orange–red outlined region defines the photometric aperture selected for light curve extraction. The red circles indicate sources identified in the Gaia DR3 catalog (Gaia Collaboration et al. 2023), including the central target (WASP-18 A) marked with a white cross (labeled 1). The size of the circles corresponds to the magnitude difference (Δm) relative to the target.
Other Images in This Article
Copyright and Terms & Conditions
© 2026. The Author(s). Published by the American Astronomical Society.

