

Image Details
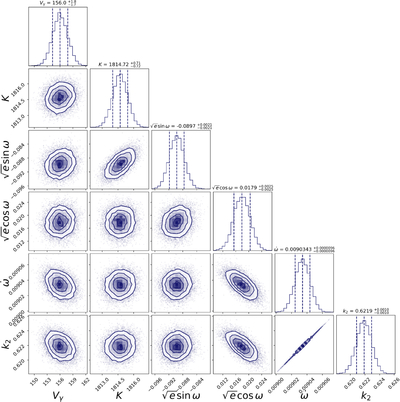
Caption: Figure 4.
Posterior probability distributions for the WASP-18 b orbital solution derived from MCMC sampling. Dashed vertical lines in the 1D histograms represent the 16th, 50th, and 84th percentiles. The tight constraint on ﹩\dot{\omega }﹩ and its consistency with previous literature confirms the stability of the apsidal signal over our 15 yr observational baseline.
Other Images in This Article
Copyright and Terms & Conditions
© 2026. The Author(s). Published by the American Astronomical Society.

Copyright ©
2026 Astronomy Image Explorer. All Rights Reserved.
