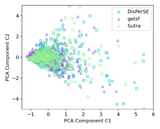
Image Details
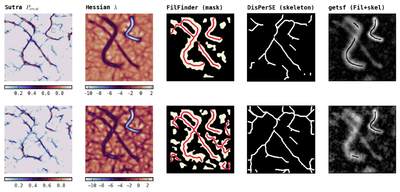
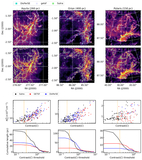
Caption: Figure 13.
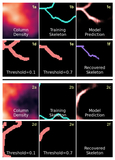
Comparison of structures extracted by different algorithms, tested on a synthetic filament. The top and bottom rows show the result on ﹩{ \mathcal F }+{ \mathcal B }﹩ and ﹩{ \mathcal F }+2\times { \mathcal B }﹩ , respectively. The panels in columns show, from left to right, (1) the crest probability map from Sutra, (2) eigenvalues of the Hessian matrix, (3) mask generated by FilFinder, (4) skeleton traced by DisPerSE, and (5) filament and skeleton obtained by getsf.
Other Images in This Article
Show More
Copyright and Terms & Conditions
© 2026. The Author(s). Published by the American Astronomical Society.
Copyright ©
2026 Astronomy Image Explorer. All Rights Reserved.