Image Details
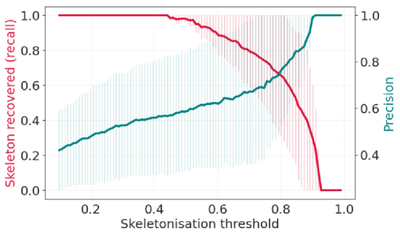
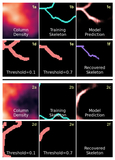
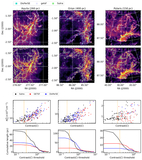
Caption: Figure 5.
Fraction of filament in the test dataset recovered by the U-Net model after thresholding and skeletonization. The solid red curve shows the median of the relation over all the chunks in the test dataset, and the vertical error bars show median absolute deviation. The solid blue line shows the fraction of predicted skeleton, which also overlaps the dis:gsf skeleton.
Other Images in This Article
Show More
Copyright and Terms & Conditions
© 2026. The Author(s). Published by the American Astronomical Society.
Copyright ©
2026 Astronomy Image Explorer. All Rights Reserved.