Image Details
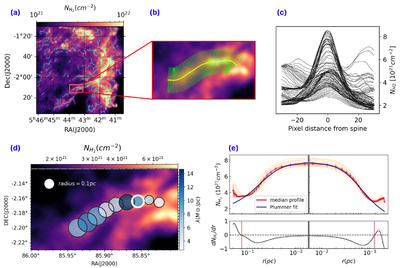
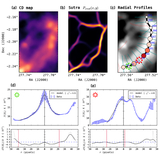
Caption: Figure 7.
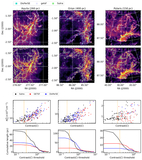
Illustration of workflow for local characterization of individual filament starting from the output of the U-Net identifier after skeletonization: (a) Skeleton obtained from the U-Net identifier. (b) Zoom-in of one filament, with the smoothened skeleton (shown by the yellow curve) and lines along which the radial profile is extracted (green lines). (c) Radial profiles for the selected filament. (d) The radial profiles are grouped together at a distance of HPBW. The size of the circle shows local width (﹩{W}_{bg}={R}_{bg}^{+}+{R}_{bg}^{-}﹩). (e) Plummer profile fit to the median radial profile for all the profiles within the group highlighted by a white circle in (d).
Other Images in This Article
Show More
Copyright and Terms & Conditions
© 2026. The Author(s). Published by the American Astronomical Society.