Image Details
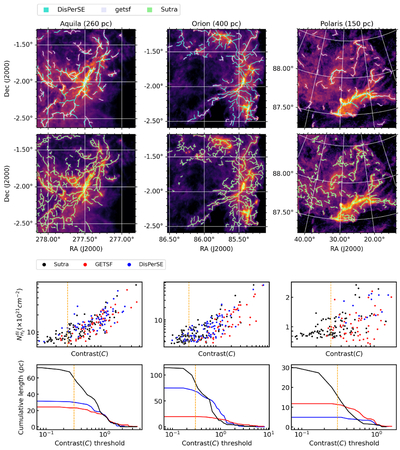
Caption: Figure 9.
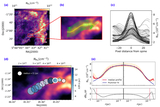
Comparison of Sutra with DisPerSE and getsf on cutouts in the Aquila, Orion, and Polaris clouds (column-wise). The image plot in the top two rows shows a comparison of DisPerSE + getsf filaments (row 1) with the Sutra filaments (row 2). The filaments are thickened for better visualization. In Aquila, both getsf and DisPerSE filaments mostly overlap. The Orion cutout is mostly dominated by DisPerSE filaments, whereas the Polaris cutout is dominated by getsf filaments. The filament level variation in filament mean intensity (﹩{{N}}_{{{\rm{H}}}_{2}}^{{\rm{\rm{fil}}}}﹩) and the total length of filaments detected as a function of the local contrast (Equation (11)) as a scatterplot (row 3) and line plot (row 4), respectively. The length is the total length of the filament having contrast above the value given on the x-axis.
Other Images in This Article
Show More
Copyright and Terms & Conditions
© 2026. The Author(s). Published by the American Astronomical Society.