Image Details
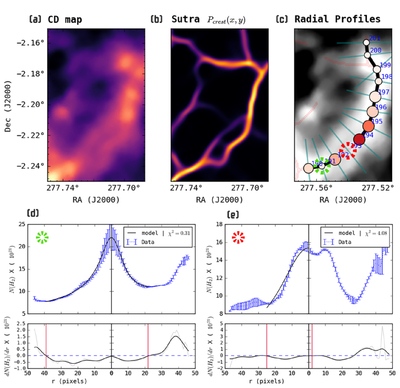
Caption: Figure 6.
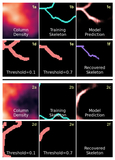
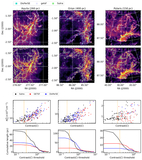
Schematic illustration of crest detection and physics-guided skeleton refinement in Sutra. (a) Input CD map. (b) Corresponding crest-likelihood map Pcrest(x, y) produced by the trained U-Net ridge detection model, where high-probability values trace filament spines. (c) Binary skeleton obtained after thresholding the crest-likelihood map and medial axis refinement. Beam-sized segments (numbered) are evaluated individually through radial profile analysis. The bottom panels show examples of (d) a “good” beam segment (green marker) yielding a low reduced χ2 and (e) shows an example of a rejected beam (red marker), due to a poor Plummer fit, on the left side and an immediate dip (≤ beam size) due to a nearby filament on the right side. The solid black line (panel (c)) shows the final skeleton.
Other Images in This Article
Show More
Copyright and Terms & Conditions
© 2026. The Author(s). Published by the American Astronomical Society.