Image Details
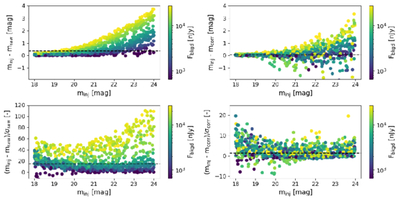
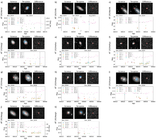
Caption: Figure 18.
The top-left panel shows the difference in magnitude between the injected magnitudes and the raw uncorrected magnitudes (minj − mraw) over the injected magnitude. The top-right panel shows the difference in magnitude between the injected magnitudes and the corrected magnitudes instead (minj − mcorr). The bottom row shows the number of standard deviations that the raw magnitudes ([minj − mraw]/σraw; bottom-left panel) and corrected magnitudes ([minj − mcorr]/σcorr; bottom-right panel) are removed from the injected magnitudes. The color in each panel represents the amount of background contamination (Fbkgd) that was present. The horizontal dashed lines in each panel indicate the median value of the entire sample.
Other Images in This Article
Show More
Copyright and Terms & Conditions
© 2026. The Author(s). Published by the American Astronomical Society.