Image Details
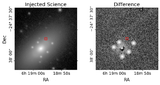
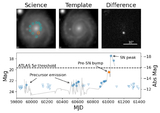
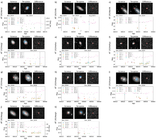
Caption: Figure 17.
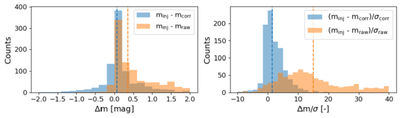
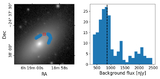
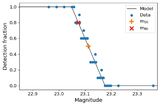
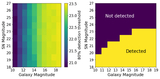
We performed a series of injection-recovery tests on epochs of SN 2025brs that had a significant amount of background contamination in order to quantify the performance of the background correction method implemented by DETECT. The left panel shows the difference in magnitude between the injected magnitudes and the raw uncorrected magnitudes (orange), as well as the difference between the injected magnitudes and the corrected magnitudes (blue). The median values for each distribution are shown with the dashed vertical lines in each panel. The right panel shows the number of standard deviations that the raw magnitudes are removed from the injected magnitudes in orange, while this is shown for the corrected magnitudes in blue. The median values for each distribution are shown with the dashed vertical lines in each panel. While it is clear that the background correction did not get rid of all image-subtraction artifacts in all epochs, the corrected magnitudes consistently outperform the raw measurements.
Other Images in This Article
Show More
Copyright and Terms & Conditions
© 2026. The Author(s). Published by the American Astronomical Society.