Image Details
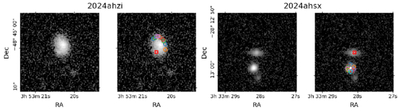
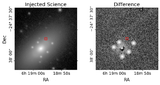
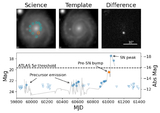
Caption: Figure 16.
The left panel shows the r-band science exposure of AT 2024ahzi (the red cross) and the possible injection locations found with DETECT (the circles), while the right panel shows the z band for AT 2024ahsx. The different colors of the injection locations represent different injection iterations. Finding injection locations is easier for nearby galaxies (e.g., SN 2025brs, see Figure 3), although it is still possible to do so for galaxies with smaller projected areas, provided that caution is used.
Other Images in This Article
Show More
Copyright and Terms & Conditions
© 2026. The Author(s). Published by the American Astronomical Society.
Copyright ©
2026 Astronomy Image Explorer. All Rights Reserved.