Image Details
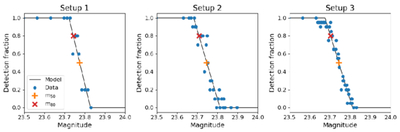
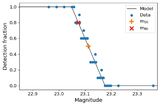
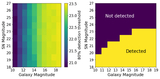
Caption: Figure 14.
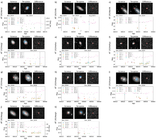
The recovery curve obtained after running DETECT with different settings (see Table 2). We increasingly sample both axes in greater detail as we move from Setup 1 (left panel) to Setup 2 (middle panel) and finally to Setup 3 (right panel). The resultant recovery curve model and detection thresholds become more reliable when we sample in greater detail.
Other Images in This Article
Show More
Copyright and Terms & Conditions
© 2026. The Author(s). Published by the American Astronomical Society.
Copyright ©
2026 Astronomy Image Explorer. All Rights Reserved.