

Image Details
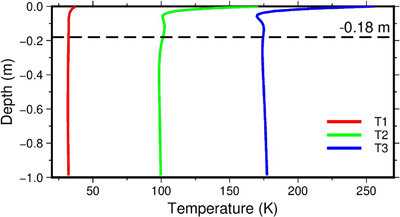
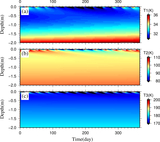
Caption: Figure 8.
The 1D temperature–depth profiles at the representative sampling locations P1–P3 for the epoch shown in Figure 7(a). The dashed line marks the representative depth of 0.18 m. The profiles illustrate the contrast between the permanently shadowed site and the illuminated sites and show that near-surface thermal gradients are substantially reduced at decimeter depths.
Other Images in This Article
Copyright and Terms & Conditions
© 2026. The Author(s). Published by the American Astronomical Society.

Copyright ©
2026 Astronomy Image Explorer. All Rights Reserved.
