

Image Details
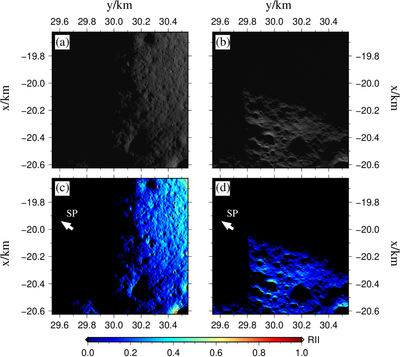
Caption: Figure 2.
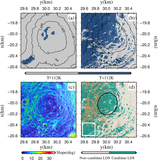
LROC orbital images (panels (a) and (b)) and corresponding simulated illumination maps (panels (c) and (d)). Panels (a) and (b) are derived from LROC images M121374298LE and M184474020RE, acquired during UTC 2010-02-21T06:50:32–06:51:43 and UTC 2012-02-21T14:32:33–14:32:53, respectively. The simulated illumination shown in panels (c) and (d) represents instantaneous RII computed at the corresponding midtimes of the image acquisition intervals, namely, UTC 2010-02-21T06:51:10 and UTC 2012-02-21T14:32:40, respectively. The white arrows indicate the direction toward the lunar south pole (SP). The horizontal and vertical axes correspond to the y- and x-axis directions of the south pole stereographic projection, respectively.
Other Images in This Article
Copyright and Terms & Conditions
© 2026. The Author(s). Published by the American Astronomical Society.

