

Image Details
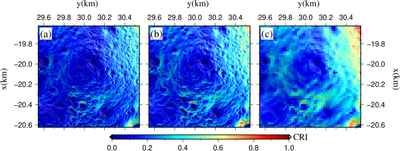
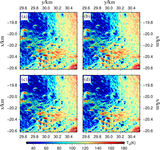
Caption: Figure 3.
CRI over the entire simulation period. Panel (a) shows the results obtained using the 1 m resolution DEM, panel (b) shows the results from the 5 m resolution DEM, and panel (c) shows the results from the 20 m resolution DEM. The x- and y-axes correspond to the x- and y-directions of the south polar stereographic projection.
Other Images in This Article
Copyright and Terms & Conditions
© 2026. The Author(s). Published by the American Astronomical Society.

Copyright ©
2026 Astronomy Image Explorer. All Rights Reserved.
