

Image Details
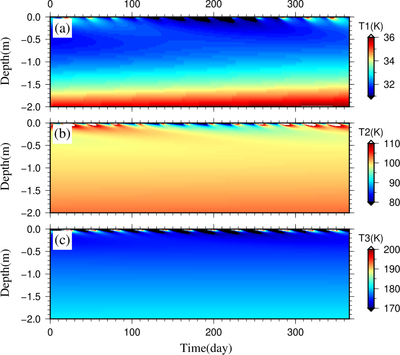
Caption: Figure 5.
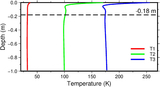
Quasi-steady annual subsurface temperature variations during 2026 at the three sampling locations. The horizontal axis denotes time (days), and the vertical axis represents subsurface depth (meters). Panels (a)–(c) correspond to points P1, P2, and P3, respectively, as defined in Figure 4.
Other Images in This Article
Copyright and Terms & Conditions
© 2026. The Author(s). Published by the American Astronomical Society.

Copyright ©
2026 Astronomy Image Explorer. All Rights Reserved.
