

Image Details
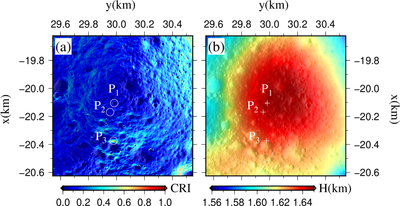
Caption: Figure 4.
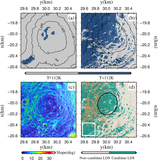
Locations of the three annual temperature sampling points, indicated by white circles and crosshairs in panels (a) and (b), respectively. Panel (a) shows the background map of CRI over the entire simulation period, while panel (b) displays the 1 m resolution DEM. The x- and y-axes correspond to the x- and y-directions of the south polar stereographic projection.
Other Images in This Article
Copyright and Terms & Conditions
© 2026. The Author(s). Published by the American Astronomical Society.

Copyright ©
2026 Astronomy Image Explorer. All Rights Reserved.
