Image Details
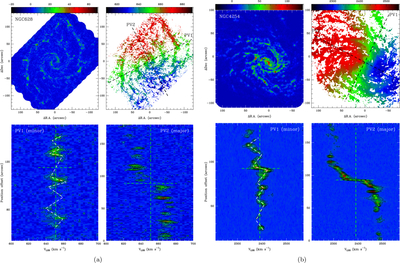
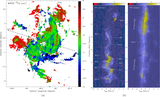
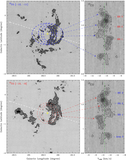
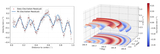
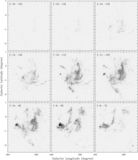
Caption: Figure 13.
(a) PHANGS CO (2–1) images of NGC 628. The top-left panel shows the CO intensity image of NGC 628 (the unit of the scale bar is K km s−1). The top-right panel shows the moment 1 image (the unit of the scale bar is km s−1). Two dashed white lines show the routings of PV diagrams shown in the bottom panels. The bottom-left panel shows the PV diagram along the minor axis of NGC 628. Dashed green lines show the position of the central cavity at the systemic velocity (∼ 651 km s−1), while dashed white lines guide the eyes for the oscillation of the velocities. The bottom-right panels show the PV diagram along the major axis of NGC 628. For the two panels, contours correspond to 0.2, 0.4, 0.6, 0.9, and 1.2 K, and then increase in steps of 0.4 K. (b) PHANGS CO (2–1) images of NGC 4254. The four panels are organized similarly to NGC 628. In the bottom two panels, dashed green lines show the position of the gas disk at the systemic velocity (∼ 2389 km s−1).
Other Images in This Article
Show More
Copyright and Terms & Conditions
© 2026. The Author(s). Published by the American Astronomical Society.