Image Details
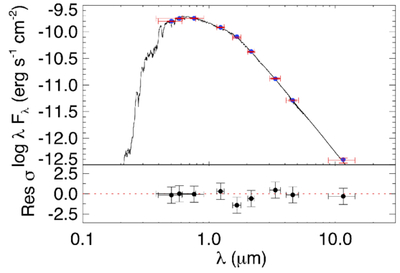
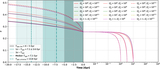
Caption: Figure 5.
Spectral energy distribution of TOI-7154. The observed photometric measurements are represented by the red symbols, while the horizontal bars are indicative of the effective width of the respective passband. The model fluxes are represented by blue points. The residuals are shown in the lower panel.
Other Images in This Article
Show More
Copyright and Terms & Conditions
© 2026. The Author(s). Published by the American Astronomical Society.
Copyright ©
2026 Astronomy Image Explorer. All Rights Reserved.