Image Details
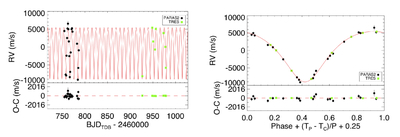
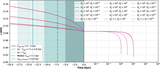
Caption: Figure 6.
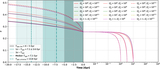
RV measurements of TOI-7154 from 20 spectroscopic observations with PARAS-2 (black points) and 8 spectroscopic observations with TRES (green squares) are shown as a function of time (left panel). The same RV data are shown as a function of the orbital phase (right panel). In both panels, the best-fit RV model obtained using EXOFASTv2 is shown by the red curve, while the residuals between the model and the observations are displayed in the corresponding lower panels.
Other Images in This Article
Show More
Copyright and Terms & Conditions
© 2026. The Author(s). Published by the American Astronomical Society.
Copyright ©
2026 Astronomy Image Explorer. All Rights Reserved.