Image Details
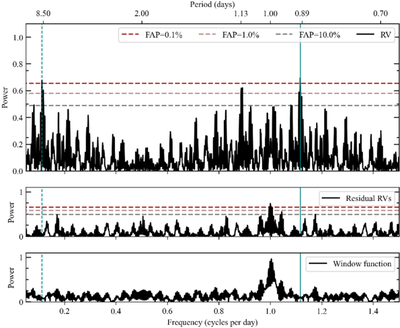
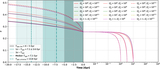
Caption: Figure 3.
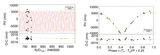
The GLS periodogram for the combined PARAS-2 and TRES RVs, the residuals RVs, and the spectral window function of TOI-7154 are shown in panels (1)–(3) (top to bottom), respectively. The periodogram shows prominent peaks at ∼0.89 days (teal solid line) and ∼8.5 days (teal dashed line). The ∼8.5 days periodicity is consistent with the TESS transit period (P ∼ 8.86 days) and represents the true orbital signal, while the ∼0.89 day peak is an alias. After removing the 8.5 day signal, no significant periodicities are found. The FAP levels corresponding to 0.1%, 1%, and 10% are shown as horizontal gray, pink, and red dashed lines, respectively.
Other Images in This Article
Show More
Copyright and Terms & Conditions
© 2026. The Author(s). Published by the American Astronomical Society.