Image Details
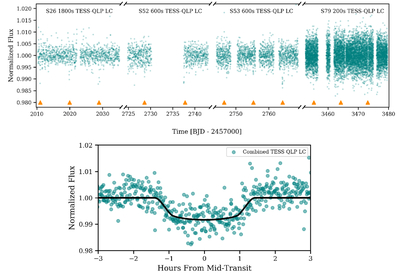
Caption: Figure 1.
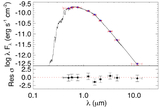
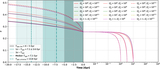
Detrended TESS LC from sectors 26, 52, 53, and 79 shown in teal color. It displays the full TESS LC plotted against time. The full LC is displayed in the upper panel, where the triangles mark the time at which transit occurs. The phase-folded LC from all sectors is shown in the lower panel, with the best-fit transit model is overplotted in black.
Other Images in This Article
Show More
Copyright and Terms & Conditions
© 2026. The Author(s). Published by the American Astronomical Society.
Copyright ©
2026 Astronomy Image Explorer. All Rights Reserved.