Image Details
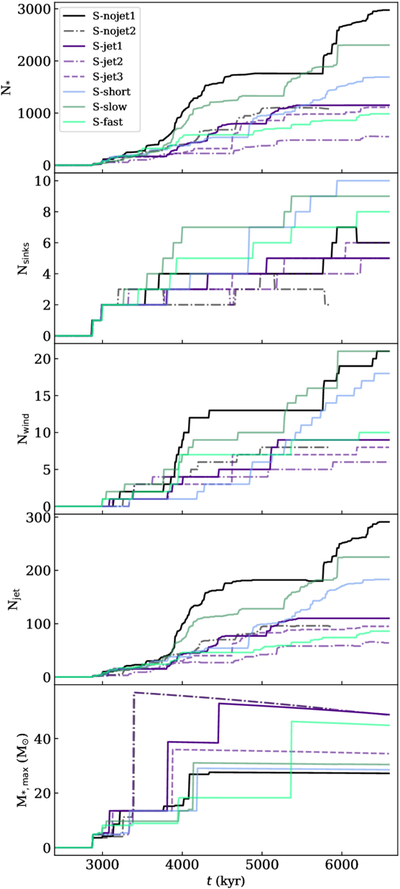
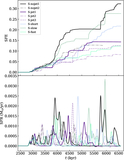
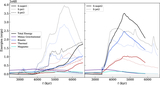
Caption: Figure 5.
A comparison of several star formation diagnostics as functions of time for the same runs shown in Figure 4. From top to bottom the panels show the total number of star particles, the total number of sink particles, the number of wind mass stars (M ≥ 7 M⊙), the number of jet mass stars (1 M⊙ ≤ M < 7 M⊙), and the most massive star on the grid (in M⊙). Two of the runs (S-nojet2 and S-jet2) form a very massive wind star at around 3400 kyr, which significantly impacts the subsequent evolution of both runs.
Other Images in This Article
Show More
Copyright and Terms & Conditions
© 2026. The Author(s). Published by the American Astronomical Society.
Copyright ©
2026 Astronomy Image Explorer. All Rights Reserved.