Image Details
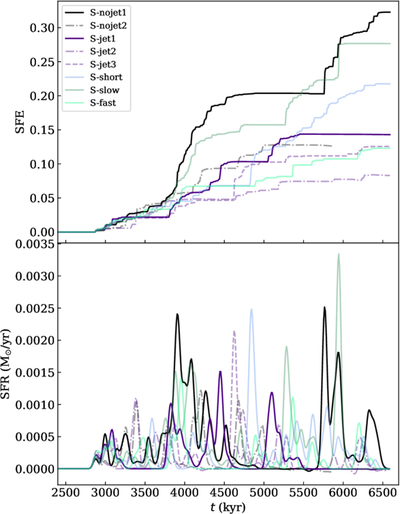
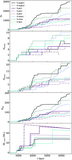
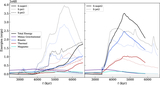
Caption: Figure 4.
A comparison of the integrated SFE and the smoothed SFR as functions of time for the eight runs with smaller initial clouds (and consistent maximum refinement) described in Section 4. The runs without jets are shown in black (S-nojet1 as a solid line and S-nojet2 as a dotted line) while the six runs with different jet parameters are shown in lines of various colors. The lower panel shows the SFR smoothed with a Gaussian filter with a standard deviation of three data points, which corresponds to approximately 30 kyr.
Other Images in This Article
Show More
Copyright and Terms & Conditions
© 2026. The Author(s). Published by the American Astronomical Society.
Copyright ©
2026 Astronomy Image Explorer. All Rights Reserved.